What Makes The Clean Room So Clean?

Roman's primary structure hangs from cables as it moves into the big clean room at NASA's Goddard Space Flight Center.
What Makes the Clean Room So Clean?
When you picture NASA’s most important creations, you probably think of a satellite, telescope, or maybe a rover. But what about the room they’re made in? Believe it or not, the room itself where these instruments are put together—a clean room—is pretty special.
A clean room is a space that protects technology from contamination. This is especially important when sending very sensitive items into space that even small particles could interfere with.
There are two main categories of contamination that we have to keep away from our instruments. The first is particulate contamination, like dust. The second is molecular contamination, which is more like oil or grease. Both types affect a telescope’s image quality, as well as the time it takes to capture imagery. Having too many particles on our instruments is like looking through a dirty window. A clean room makes for clean science!

Two technicians clean the floor of Goddard’s big clean room.
Our Goddard Space Flight Center in Greenbelt, Maryland has the largest clean room of its kind in the world. It’s as tall as an eight-story building and as wide as two basketball courts.
Goddard’s clean room has fewer than 3,000 micron-size particles per cubic meter of air. If you lined up all those tiny particles, they’d be no longer than a sesame seed. If those particles were the size of 16-inch (0.4-meter) inflatable beach balls, we’d find only 3,000 spread throughout the whole body of Mount Everest!

A clean room technician observes a sample under a microscope.
The clean room keeps out particles larger than five microns across, just seven percent of the width of an average human hair. It does this via special filters that remove around 99.97% of particles 0.3 microns and larger from incoming air. Six fans the size of school buses spin to keep air flowing and pressurize the room. Since the pressure inside is higher, the clean air keeps unclean air out when doors open.

A technician analyzes a sample under ultraviolet light.
In addition, anyone who enters must wear a “bunny suit” to keep their body particles away from the machinery. A bunny suit covers most of the person inside. Sometimes scientists have trouble recognizing each other while in the suits, but they do get to know each other’s mannerisms very well.

This illustration depicts the anatomy of a bunny suit, which covers clean room technicians from head to toe to protect sensitive technology.
The bunny suit is only the beginning: before putting it on, team members undergo a preparation routine involving a hairnet and an air shower. Fun fact – you’re not allowed to wear products like perfume, lotion, or deodorant. Even odors can transfer easily!

Six of Goddard’s clean room technicians (left to right: Daniel DaCosta, Jill Bender, Anne Martino, Leon Bailey, Frank D’Annunzio, and Josh Thomas).
It takes a lot of specialists to run Goddard’s clean room. There are 10 people on the Contamination Control Technician Team, 30 people on the Clean Room Engineering Team to cover all Goddard missions, and another 10 people on the Facilities Team to monitor the clean room itself. They check on its temperature, humidity, and particle counts.

A technician rinses critical hardware with isopropyl alcohol and separates the particulate and isopropyl alcohol to leave the particles on a membrane for microscopic analysis.
Besides the standard mopping and vacuuming, the team uses tools such as isopropyl alcohol, acetone, wipes, swabs, white light, and ultraviolet light. Plus, they have a particle monitor that uses a laser to measure air particle count and size.
The team keeping the clean room spotless plays an integral role in the success of NASA’s missions. So, the next time you have to clean your bedroom, consider yourself lucky that the stakes aren’t so high!
Make sure to follow us on Tumblr for your regular dose of space!
More Posts from Nasa and Others
What’s Up for December 2016?
What’s Up for December? Mars and Neptune above the crescent moon and a New Year’s Eve comet!

2016 ends with fireworks as three planets line up as if ejected from a Roman candle. Mercury, Venus and Mars are visible above the sunset horizon all month long.

As Venus climbs higher in the sky, it looks brighter and larger than it appeared last month.

On New Year’s Eve, Mars and Neptune appear very close to each other. Through telescopes, rusty red Mars and blue-green Neptune‘s colors contrast beautifully.

There are two meteor showers this month – the Geminds and the Ursids. The best time to see the reliable Geminids will be next year, when the full moon won’t be so bright and interfering. This year, however, we may luck out and see some of the brighter meteors on the evening of the 13th and the morning of the 14th.

The best time to view the Ursids, radiating from Ursa Minor, or the little Dipper, will be from midnight on the 21st until about 1 a.m. on the 22nd, before the moon rises. They may be active on the 23rd and 24th, too.

We haven’t had a good easy-to-see comet in quite a while, but beginning in December and through most of 2017 we will have several binocular and telescopic comets to view.

The first we’ll be able to see is Comet 45P/Honda-Mrkos-Pajdušáková, which will appear low on the western horizon on December 15th. On that date, the comet will pass the pretty globular cluster M75.

By the 21st, it will appear edge-on, sporting a bluish-green head and a thin, sharp view of the fan-shaped tail.

On New Years Eve, the comet and the crescent moon will rendezvous to say farewell to 2016. A “periodic” comet is a previously-identified comet that’s on a return visit. Periodic comet 45P returns to the inner solar system every 5.25 years, and that’s the one that will help us ring in the new year.

Watch the full What’s Up for December video:
Make sure to follow us on Tumblr for your regular dose of space: http://nasa.tumblr.com
We’re On a Mission to Study The Zone Where Earth Meets Space!
We’re launching ICON — short for Ionospheric Connection Explorer — a mission to explore the dynamic region where Earth meets space: the ionosphere!

Earth’s ionosphere stretches from 50 to 400 miles above the ground, overlapping the top of our atmosphere and the very beginning of space. The Sun cooks gases there until they lose an electron (or two or three), creating a sea of electrically charged particles. But, the ionosphere also responds to weather patterns from Earth rippling up. These changes are complex and tricky to understand.

That’s why we’re launching ICON! Changes in the ionosphere can affect astronauts, satellites and communications signals we use every day, like radio or GPS. Understanding these changes could help us eventually predict them — and better protect our technology and explorers in space.

ICON will track changes in the ionosphere by surveying airglow. It’s a natural feature of Earth’s that causes our atmosphere to constantly glow. The Sun excites gases in the upper atmosphere, so they emit light. From 360 miles above Earth, ICON will photograph airglow to measure the ionosphere’s winds, composition and temperature. ICON also carries an instrument that will capture and measure the particles directly around the spacecraft.

ICON is scheduled to launch on Oct. 10, on a Northrop Grumman Pegasus XL rocket. The night of launch, the rocket is flown up to the sky by Northrop Grumman’s L-1011 Stargazer airplane, which takes off from Cape Canaveral Air Force Station in Florida. From 40,000 feet above the open ocean, the Pegasus XL rocket drops from the plane and free-falls for about five seconds before igniting and carrying ICON into orbit.

NASA TV coverage of the launch starts at 9:15 p.m. EDT on Oct. 10 at nasa.gov/live. You can also follow along on Twitter, Facebook or at nasa.gov/icon.
Make sure to follow us on Tumblr for your regular dose of space: http://nasa.tumblr.com.
What, in your opinion, is Perseverance's most groundbreaking experiment/ instrument?
The magnetic field lines between a pair of active regions formed a beautiful set of swaying arches, seen in this footage captured by our Solar Dynamics Observatory on April 24-26, 2017.
These arches, which form a connection between regions of opposite magnetic polarity, are visible in exquisite detail in this wavelength of extreme ultraviolet light. Extreme ultraviolet light is typically invisible to our eyes, but is colorized here in gold.
Take a closer look: https://go.nasa.gov/2pGgYZt
Make sure to follow us on Tumblr for your regular dose of space: http://nasa.tumblr.com
6 Reasons NOAA’s GOES-R Satellite Matters

NOAA’s GOES-R weather satellite will soon be launched into space – becoming our nation’s most advanced geostationary satellite to date. So what does that mean for you? Here are six reasons to be excited about GOES-R:
1. GOES-R helps you know what the weather is going to be
Perhaps you turn on the TV or radio, or check your favorite weather website or smartphone weather app to get the latest forecast. No matter the platform of your weather forecast, the data and information for those forecasts come from NOAA’s National Weather Service (NWS).

Weather satellites, like the GOES satellites, are the backbone of NWS forecasts. GOES-R will be more advanced than any other weather satellite of its kind and could make the answer to the question “What’s the weather going to be?” more detailed and accurate both in the near term and further out into the future.
2. GOES-R will get better data faster than ever before
Do you live in an inland state, a state with a coastline or a state with a mountain range? Great, that’s all of you! Data from the GOES-R satellite will be a game changer for forecasters in your area.

Here’s why: satellites are fitted with instruments that observe weather and collect measurements. The primary instrument on the new GOES-R satellite will collect three times more data and provide four times better resolution and more than five times faster coverage than current satellites! This means the satellite can scan Earth’s Western Hemisphere every five minutes and as often as every 30 seconds in areas where severe weather forms, as compared to approximately every 30 minutes with the current GOES satellites. Pretty cool, right?
3. GOES-R is a real life-saver
This expedited data means that forecasts will be timelier, with more “real-time” information in them, allowing NWS to make those warnings and alerts that much faster, thereby potentially saving lives.

And a faster forecast is a big deal for our economy. Commercial shipping and aviation are just two examples of industries that rely on up-to-date weather data for critical decisions about how to route ships and safely divert planes around storms.
4. GOES-R helps keep the electricity flowing
We all depend on a power grid for virtually every aspect of modern life. But power grids are vulnerable to bursts of energy from the sun that can affect us on Earth.

Luckily, GOES-R will be sitting over 22,000 miles above us, and in addition to measuring weather on Earth, it will monitor incoming space weather.
5. GOES-R is truly revolutionary
How different will GOES-R be? Imagine going from your classic black and white TV to a new high definition one. It will enable NOAA to gather data using three times more channels, four times the resolution, five times faster than the current GOES satellites.

This faster, more accurate data means better observations of developing storms and other severe weather.
6. GOES-R will be a continuing a legacy
GOES-R may be the first of its kind, but it is the heir to a rich tradition of geostationary earth observation.

In fact, NOAA has continuously operated a GOES satellite for over 40 years. Since 1975, GOES satellites have taken well over 3 million images!

The GOES-R satellite is scheduled to launch Saturday, Nov. 19 at 5:42 p.m. EST aboard a United Launch Alliance Atlas V rocket. Liftoff will occur from our Kennedy Space Center in Florida.
Learn more about the mission: https://www.nesdis.noaa.gov/GOES-R-Mission
Article Credit: NOAA
Make sure to follow us on Tumblr for your regular dose of space: http://nasa.tumblr.com
From Microscopic to Multicellular: Six Stories of Life that We See from Space
Life. It's the one thing that, so far, makes Earth unique among the thousands of other planets we've discovered. Since the fall of 1997, NASA satellites have continuously and globally observed all plant life at the surface of the land and ocean. During the week of Nov. 13-17, we are sharing stories and videos about how this view of life from space is furthering knowledge of our home planet and the search for life on other worlds.

Earth is the only planet with life, as far as we know. From bacteria in the crevices of the deepest oceans to monkeys swinging between trees, Earth hosts life in all different sizes, shapes and colors. Scientists often study Earth from the ground, but some also look to our satellites to understand how life waxes and wanes on our planet.
Over the years, scientists have used this aerial view to study changes in animal habitats, track disease outbreaks, monitor forests and even help discover a new species. While this list is far from comprehensive, these visual stories of bacteria, plants, land animals, sea creatures and birds show what a view from space can reveal.
1. Monitoring the single-celled powerhouses of the sea

Known as the grass of the ocean, phytoplankton are one of the most abundant types of life in the ocean. Usually single-celled, these plant-like organisms are the base of the marine food chain. They are also responsible for the only long-term transfer of carbon dioxide from Earth’s atmosphere to the ocean.
Even small changes in phytoplankton populations can affect carbon dioxide concentrations in the atmosphere, which could ultimately affect Earth’s global surface temperatures. Scientists have been observing global phytoplankton populations continuously since 1997 starting with the Sea-Viewing Wide Field-of View Sensor (SeaWiFS). They continue to study the small life-forms by satellite, ships and aircrafts.
2. Predicting cholera bacteria outbreaks
Found on the surface of zooplankton and in contaminated water, the bacteria that cause the infectious disease cholera — Vibrio cholerae — affect millions of people every year with severe diarrhea, sometimes leading to death. While our satellite sensors can’t detect the actual bacteria, scientists use various satellite data to look for the environmental conditions that the bacteria thrive in.
Specifically, microbiologist Rita Colwell at the University of Maryland, College Park, and West Virginia University hydrologist Antar Jutla studied data showing air and ocean temperature, salinity, precipitation, and chlorophyllconcentrations, the latter a marker for zooplankton. Anticipating where the bacteria will bloom helps researchers to mitigate outbreaks.

Recently, Colwell and Jutla have been able to estimate cholera risk after major events, such as severe storms, by looking at satellite precipitation data, air temperature, and population maps. The two maps above show the team's predicted cholera risk in Haiti two weeks after Hurricane Matthew hit over October 1-2, 2016 and the actual reported cholera cases in October 2016.
3. Viewing life on land
From helping preserve forests for chimpanzees to predicting deer population patterns, scientists use our satellites to study wildlife across the world. Satellites can also see the impacts of perhaps the most relatable animal to us: humans. Every day, we impact our planet in many ways including driving cars, constructing buildings and farming – all of which we can see with satellites.

Our Black Marble image provides a unique view of human activity. Looking at trends in our lights at night, scientists can study how cities develop over time, how lighting and activity changes during certain seasons and holidays, and even aid emergency responders during power outages caused by natural disasters.
4. Tracking bird populations
Scientists use our satellite data to study birds in a variety of ways, from understanding their migratory patterns, to spotting potential nests, to tracking populations. In a rather creative application, scientists used satellite imagery to track Antarctica’s emperor penguin populations by looking for their guano – or excrement.

Counting emperor penguins from the ground perspective is challenging because they breed in some of the most remote and cold places in the world, and in colonies too large to easily count manually. With their black and white coats, emperor penguins are also difficult to count from an aerial view as they sometimes blend in with shadows on the ice. Instead, Phil Trathan and his colleagues at the British Antarctic Survey looked through Landsat imagery for brown stains on the sea ice. By looking for penguin droppings, Trathan said his team identified 54 emperor penguin colonies along the Antarctic coast.
5. Parsing out plant life
Just as we see plants grow and wilt on the ground, satellites observe the changes from space. Flourishing vegetation can indicate a lively ecosystem while changes in greenery can sometimes reveal natural disasters, droughts or even agricultural practices. While satellites can observe plant life in our backyards, scientists can also use them to provide a global picture.

Using data from satellites including SeaWiFS, and instruments including the NASA/NOAA Visible Infrared Imaging Radiometer Suite and the Moderate Resolution Imaging Spectroradiometer, scientists have the most complete view of global biology to date, covering all of the plant life on land and at the surface of the ocean.
6. Studying life under the sea
Our satellites have helped scientists study creatures living in the oceans whether it’s finding suitable waters for oysters or protecting the endangered blue whale. Scientists also use the data to learn more about one of the most vulnerable ecosystems on the planet – coral reefs.

They may look like rocks or plants on the seafloor, but corals are very much living animals. Receiving sustenance from photosynthetic plankton living within their calcium carbonate structures, coral reefs provide food and shelter for many kinds of marine life, protect shorelines from storms and waves, serve as a source for potential medicines, and operate as some of the most diverse ecosystems on the planet.

However, coral reefs are vulnerable to the warming of the ocean and human activity. Our satellites measure the surface temperature of ocean waters. These measurements have revealed rising water temperatures surrounding coral reef systems around the world, which causes a phenomenon known as “coral bleaching.” To add to the satellite data, scientists use measurements gathered by scuba divers as well as instruments flown on planes.
During the week of Nov. 13-17, check out our stories and videos about how this view of life from space is furthering knowledge of our home planet and the search for life on other worlds. Follow at www.nasa.gov/Earth.
Make sure to follow us on Tumblr for your regular dose of space: http://nasa.tumblr.com.
What in the Universe is an Exoplanet?
Simply put, an exoplanet is a planet that orbits another star.
All of the planets in our solar system orbit around the Sun. Planets that orbit around other stars outside our solar system are called exoplanets.

Just because a planet orbits a star (like Earth) does not mean that it is automatically stable for life. The planet must be within the habitable zone, which is the area around a star in which water has the potential to be liquid…aka not so close that all the water would evaporate, and not too far away where all the water would freeze.

Exoplanets are very hard to see directly with telescopes. They are hidden by the bright glare of the stars they orbit. So, astronomers use other ways to detect and study these distant planets by looking at the effects these planets have on the stars they orbit.

One way to search for exoplanets is to look for "wobbly" stars. A star that has planets doesn’t orbit perfectly around its center. From far away, this off-center orbit makes the star look like it’s wobbling. Hundreds of planets have been discovered using this method. However, only big planets—like Jupiter, or even larger—can be seen this way. Smaller Earth-like planets are much harder to find because they create only small wobbles that are hard to detect.
How can we find Earth-like planets in other solar systems?
In 2009, we launched a spacecraft called Kepler to look for exoplanets. Kepler looked for planets in a wide range of sizes and orbits. And these planets orbited around stars that varied in size and temperature.

Kepler detected exoplanets using something called the transit method. When a planet passes in front of its star, it’s called a transit. As the planet transits in front of the star, it blocks out a little bit of the star's light. That means a star will look a little less bright when the planet passes in front of it. Astronomers can observe how the brightness of the star changes during a transit. This can help them figure out the size of the planet.

By studying the time between transits, astronomers can also find out how far away the planet is from its star. This tells us something about the planet’s temperature. If a planet is just the right temperature, it could contain liquid water—an important ingredient for life.
So far, thousands of planets have been discovered by the Kepler mission.
We now know that exoplanets are very common in the universe. And future missions have been planned to discover many more!
Next month, we’re launching an explorer-class planet finder — the Transiting Exoplanet Survey Satellite (TESS). This mission will search the entire sky for exoplanets — planets outside our solar system that orbit sun-like stars.
Make sure to follow us on Tumblr for your regular dose of space: http://nasa.tumblr.com.
What’s Up for February?
What's Up for February? Look to the night sky for a brighter Venus, Comet 45P, asteroid Vesta and more.
Tonight, you can see Venus along with a crescent moon, Mars and Uranus just after sunset. No binoculars needed!

While there are no meteor showers this month, behold the zodiacal light!

This phenomenon is caused when sunlight reflects off dust particles in the plane of our solar system. Use Venus and Mars as a cone-shaped guide on the western horizon in late February and March.

Comet 45P will be visible using binoculars and telescope and will make its closest approach to Earth on February 11.

Finally, bright asteroid Vesta can be found in the constellation Pisces.
Follow us on Tumblr for your regular dose of space: http://nasa.tumblr.com
10 Ground-breaking Earth Satellite Images from 2018
In 2018, our satellites captured beautiful imagery from throughout the solar system and beyond. However, some of our favorite visualizations are of this very planet. While this list is by no means exhaustive, it does capture some Earth satellite images from this year that are both visually striking as well as scientifically informative. This list also represents a broad variety of Earth’s features, as well as satellite instrumentation. Take a journey with our eyes in the sky!
10. Hurricane Florence

Before making landfall, Hurricane Florence churned in the Atlantic for a full two weeks — making it among the longest-lived cyclones of the 2018 season. When it finally did hit land on Sep. 14, the storm devastated the southeastern U.S. coast with intense winds, torrential rains and severe flooding.
This natural-color image was acquired by MODIS on the Terra Satellite on Sep. 12, 2018.
Images like this, as well as other satellite information, were used to anticipate the impact of the storm. Our Disasters Program created flood proxy maps that were shared with the Federal Emergency Management Agency (FEMA) and the National Guard to estimate how many and which communities would be most affected by the storm, in order to help prepare recovery efforts ahead of time.
9. Australia’s Lake Eyre Basin

The Lake Eyre Basin covers one-sixth of Australia and is one of the world’s largest internally draining river systems. However, the rivers supported by this system are ephemeral, meaning that they only run for short periods of time following unpredictable rain — the rest of the time, the Basin is a dry, arid desert.
However, when the heavy rain comes, the basin erupts in an explosion of green. In this false-color image captured by the Operational Land Imager (OLI) on Landsat 8 on Apr. 25, 2018, you can see how the vegetation completely envelops the spaces where the water has receded. (Flood water is indicated by light blue, and vegetation is indicated by light green.)
Satellites are an excellent tool for tracking greening events that are followed by flooding. These events offer opportunities for predictive tools as well as recreation.
8. Alaska’s Chukchi Sea

A Monet painting comes to life as the Chukchi Sea swirls with microscopic marine algae.
This image was captured off the Alaskan coast by OLI on Landsat 8 on Jun. 18, 2018. After the Arctic sea ice breaks up each spring, the nutrient-rich Bering Sea water mixes with the nutrient-poor Alaskan coastal water. Each type of water brings with it a different type of phytoplankton and the surface waters have just enough light for the algae to populate and flourish. The result is these mesmerizing patterns of turquoise and green.
This image represents one piece of much larger, incredibly complex ecosystem. While one would not normally associate the breaking up of sea ice with phytoplankton blooms, it is an intricate process of the phytoplankton life cycle. The size of the blooms have varied greatly from year to year, and experts are unsure why. Images like these can help scientists track the development of these blooms and link it to other environmental changes.
7. Hawaii’s Kilauea

Sometimes fresh lava is best viewed in infrared.
This false-color image of Kilauea, captured by OLI on Landsat 8 on May 23, 2018, shows the infrared signal emitted by lava flowing toward the sea. The purple areas surrounding the glowing lava are clouds lit from below, indicating that this image was taken through a break in the clouds.
The Puʻu ʻŌʻō Kupaianaha eruption has been continuously spewing red-hot lava since 1983, making it the longest eruption at Kilauea in recorded history. However, new fissures opened up this year that forced many to evacuate the area. Hawaii’s largest lake evaporated in hours and hundreds of homes were destroyed in Vacationland and Kapoho.
Imagery, seismometers and ground-based instruments were used to track the underground movement of magma. Infrared imagery can be incredibly helpful in disasters like this when you to view data that cannot be observed with the naked eye.
6. California’s Woolsey Burn Scar

Nothing quite encapsulates the destruction of a wildfire like a photo from outer space.
This image of the Woolsey Fire aftermath in Southern California was captured on Nov. 18, 2018 by the Advanced Spaceborned Thermal Emission and Reflection Radiometer (ASTER) on the Terra satellite. This false-color infrared image has been enhanced to clearly show the burned vegetation (indicated by brown) and the vegetation that survived unscathed (indicated by green).
The Woolsey Fire clearly left its mark, with almost 152 square miles (394 square km) and 88% of the Santa Monica Mountains National Recreation Area badly burned. Images like this one can assist fire managers in the area plan for recovery.
5. Bangladesh’s Padma River

As the years go by, the Padma River grows and shrinks, twists and turns. It never has a fixed shape, and as a result, thousands of people must regularly adapt to the constant changes in the river’s 75-mile (130-km) shoreline.
This image captured on Jan. 20, 2018 by OLI on Landsat 8 depicts one of the major rivers of Bangladesh. For thirty years, scientists have been tracking the erosion of the river with satellite imagery. Combinations of shortwave infrared, near infrared, and visible light are used to detect differences year-to-year in width, depth, and shape of the river. Sometimes the river splits off, but then rejoins again later. These patterns are created by the river carrying and depositing sediment, shaping the curves of the path of water.
Monitoring the Padma River is going to become especially important as a new bridge development project advances in the Char Janajat area. Although the bridge will most certainly help shorten travel times for citizens, nobody is quite sure how the river erosion might affect the construction and vice versa.
4. Alaska’s Yakutat Glacier

It’s hard to believe that Harlequin Lake was once all dry land — but it only started to form once Yakutat Glacier started melting. The lake appeared at the beginning of the twentieth century, and has been growing rapidly ever since.
In this hauntingly beautiful image, captured on Sep. 21 2018 by OLI on Landsat 8, the effect of climate change is apparent — especially when compared to earlier images of the region.
Unless the climate warming starts to reverse very soon — which scientists consider very unlikely — Yakutat could be gone as soon as 2070.
3. South Africa’s Theewaterskloof

Cape Town is a seaside city planted on the tip of South Africa. It’s a city known for its beaches and biodiversity — it also almost became known as the first major city to officially run out of water.
This image of Cape Town’s largest reservoir — Theewaterskloof — was acquired on Jul. 9th, 2018 by OLI on Landsat 8. By the time this photo was taken, the city’s main reservoirs stood at 55%. This was a huge increase from where it stood just six months earlier: just 13%.
The severe water shortage in the region started in 2015, only to become more threatening after three successive and unusually dry years. The entire city was preparing for Day Zero — the day the tap water would be shut off.
Despite forecasts that Day Zero would arrive in April, a combination of heavier rains and local conservation efforts restored the majority of the reservoir.
2. Aerosol Earth

Aerosols are all around us. From the smoke from a fire, to the dust in the wind to the salt in sea spray — these solid particles and liquid droplets are always swirling in our atmosphere, oftentimes unseen.
The Goddard Earth Observing System Forward Processing (GEOS FP) model uses mathematical equations to model what is happening in our atmosphere. The inputs for its equations — temperature, moisture, wind, etc. — come from our satellites and ground sensors.
This visualization was compiled on Aug. 24, 2018 — obviously a busy day for aerosols in our atmosphere. Swirls of sea salt (indicated by blue) reveal typhoons Soulik and Cimaron heading straight towards South Korea and Japan. A haze of black carbon (indicated by red) suffuse from agricultural burning in Africa and large wildfires in North America. And clouds of dust (indicated by purple) float off the Sahara desert.
1. Camp Fire

With nearly a hundred fatalities, hundreds of thousands of acres burned and billions of dollars of damage, the world watched in horror as Camp Fire grew to become the most destructive California wildfire in recorded history.
This image was captured on Nov. 8, 2018 by OLI on Landsat 8 on the same day Camp Fire ignited. It consolidates both visible light and shortwave-infrared light in order to highlight the active fire. Strong winds and dry conditions literally fanned the flames and spread this wildfire like a rash.
This image has not only become the iconic portrait for Camp Fire, it is also sobering representation of how quickly a fire can grow out of control in a short amount of time. Even from space, you can almost smell the massive plumes of smoke and feel the heat of the fires.
Whether you realize it or not, our Earth satellite missions are collecting data everyday in order to monitor environmental changes and prepare for natural disasters. If your interest is piqued by this list, head over to the Earth Observatory. The Earth Observatory updates daily with fresh, new content — brought to you by none other than our eyes in the sky.
Make sure to follow us on Tumblr for your regular dose of space: http://nasa.tumblr.com

Hubble Space Telescope: Exploring the Cosmos and Making Life Better on Earth
In the 35 years since its launch aboard space shuttle Discovery, the Hubble Space Telescope has provided stunning views of galaxies millions of light years away. But the leaps in technology needed for its look into space has also provided benefits on the ground. Here are some of the technologies developed for Hubble that have improved life on Earth.

Image Sensors Find Cancer
Charge-coupled device (CCD) sensors have been used in digital photography for decades, but Hubble’s Space Telescope Imaging Spectrograph required a far more sensitive CCD. This development resulted in improved image sensors for mammogram machines, helping doctors find and treat breast cancer.
Laser Vision Gives Insights
In preparation for a repair mission to fix Hubble’s misshapen mirror, Goddard Space Flight Center required a way to accurately measure replacement parts. This resulted in a tool to detect mirror defects, which has since been used to develop a commercial 3D imaging system and a package detection device now used by all major shipping companies.
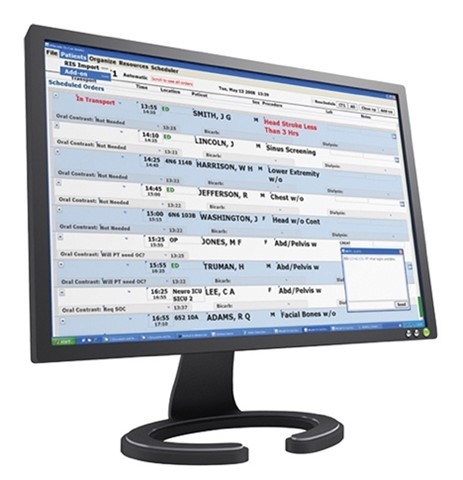
Optimized Hospital Scheduling
A computer scientist who helped design software for scheduling Hubble’s observations adapted it to assist with scheduling medical procedures. This software helps hospitals optimize constantly changing schedules for medical imaging and keep the high pace of emergency rooms going.

Optical Filters Match Wavelengths and Paint Swatches
For Hubble’s main cameras to capture high-quality images of stars and galaxies, each of its filters had to block all but a specific range of wavelengths of light. The filters needed to capture the best data possible but also fit on one optical element. A company contracted to construct these filters used its experience on this project to create filters used in paint-matching devices for hardware stores, with multiple wavelengths evaluated by a single lens.
Make sure to follow us on Tumblr for your regular dose of space!

-
 haruzen-ampy reblogged this · 1 month ago
 -
 klugpuuo reblogged this · 1 month ago
 -
 epsilon-system reblogged this · 1 month ago
 -
 thecoolattacollective reblogged this · 1 month ago
 -
 iliveinafantsyworldlol liked this · 1 month ago
 -
 blakelafaesideb reblogged this · 2 months ago
 -
 blakelafae reblogged this · 2 months ago
 -
blakelafae liked this · 2 months ago
-
 afrotumble reblogged this · 2 months ago
 -
afrotumble liked this · 3 months ago
-
 musslebrains liked this · 3 months ago
 -
 daydreams-and-tea liked this · 6 months ago
 -
 odinsblog liked this · 8 months ago
 -
 sixbluespiders reblogged this · 9 months ago
 -
sixbluespiders liked this · 9 months ago
-
 shepfax liked this · 10 months ago
 -
 aquamarine-dream-queen liked this · 10 months ago
 -
 augustinianseptember liked this · 11 months ago
 -
 pphalaen0psis liked this · 11 months ago
 -
 roveyne liked this · 11 months ago
 -
roveyne reblogged this · 11 months ago
-
 belladonna-303 liked this · 1 year ago
 -
 hyper0bject reblogged this · 1 year ago
 -
hyper0bject liked this · 1 year ago
-
 o-francisco-silva liked this · 1 year ago
 -
 lazicepie liked this · 1 year ago
 -
 magnificentnachobeliever liked this · 1 year ago
 -
 glasstown-resident reblogged this · 1 year ago
 -
 notreallyhereami liked this · 1 year ago
 -
 sacrificialvirgins reblogged this · 1 year ago
 -
sacrificialvirgins liked this · 1 year ago
-
 aspen-lee liked this · 1 year ago
 -
 theresatm liked this · 1 year ago
 -
 blackspadeszx liked this · 1 year ago
 -
 dalishpariah liked this · 1 year ago
 -
 sadgayscientist reblogged this · 1 year ago
 -
sadgayscientist liked this · 1 year ago
-
 indigocloudofnarcolepsy liked this · 1 year ago
 -
 a-mess-of-links reblogged this · 1 year ago
 -
 mim8icri liked this · 1 year ago
 -
 valentinsylve reblogged this · 1 year ago
 -
 fifi-la-fumeuse reblogged this · 1 year ago
 -
 peachyminx22 liked this · 1 year ago
 -
 fluffyfairyzz reblogged this · 1 year ago
 -
bi-bee159 liked this · 1 year ago
-
 prettiestponyawards reblogged this · 1 year ago
Explore the universe and discover our home planet with the official NASA Tumblr account
1K posts